Climate shows what each month of the year is usually like, averaged over the last ten years, to help you plan a passage: when the trade winds set in, where gales are common, which way the swell runs, and how much rain to expect. It’s part of OceanPulse Elite.
Open Climate#
In the sidebar, under Tools, tap Climate. It opens on this month. The first time, the map centres on your location; after that it opens where you left it.
What you’re looking at#
Every layer is a ten-year average for one calendar month, like November, 2016–2025. The averages come from ERA5, ECMWF’s reconstruction of the past weather from satellites, buoys, ships, aircraft, and weather stations, sampled every three hours. Currents come from Copernicus Marine’s ocean reanalysis.
They’re averages, not a forecast. Any one year can be very different, so check the forecast before you leave.
Each month updates about a week after it ends: when November 2026 is over, November’s averages move on to 2017–2026.
Choose a layer#
The strip along the bottom has eight layers:
- Wind and Waves draw a grid of roses over the average wind speed or wave height (see below).
- Currents shows the average surface current, moving.
- Sea Temp and Air Temp show the month’s average temperature.
- Rain is the average total for the month, in mm or inches.
- Pressure shows the average sea-level pressure with isobars every 4 hPa, so the Azores High or the Pacific High stands out.
- Storms is the share of days with thunderstorm conditions.
Read a rose#
Each rose shows how often the wind (or the waves) came from each of 16 directions. The longer the petal, the more often it came from that way. Its colours show how strong, on the same scale as the map under it: in the trade winds, a long east-northeast petal that’s mostly green and orange means the wind usually blows from there at 10 to 20 knots.
Roses sit on real points of the data, never blended together, and spread out as you zoom out.
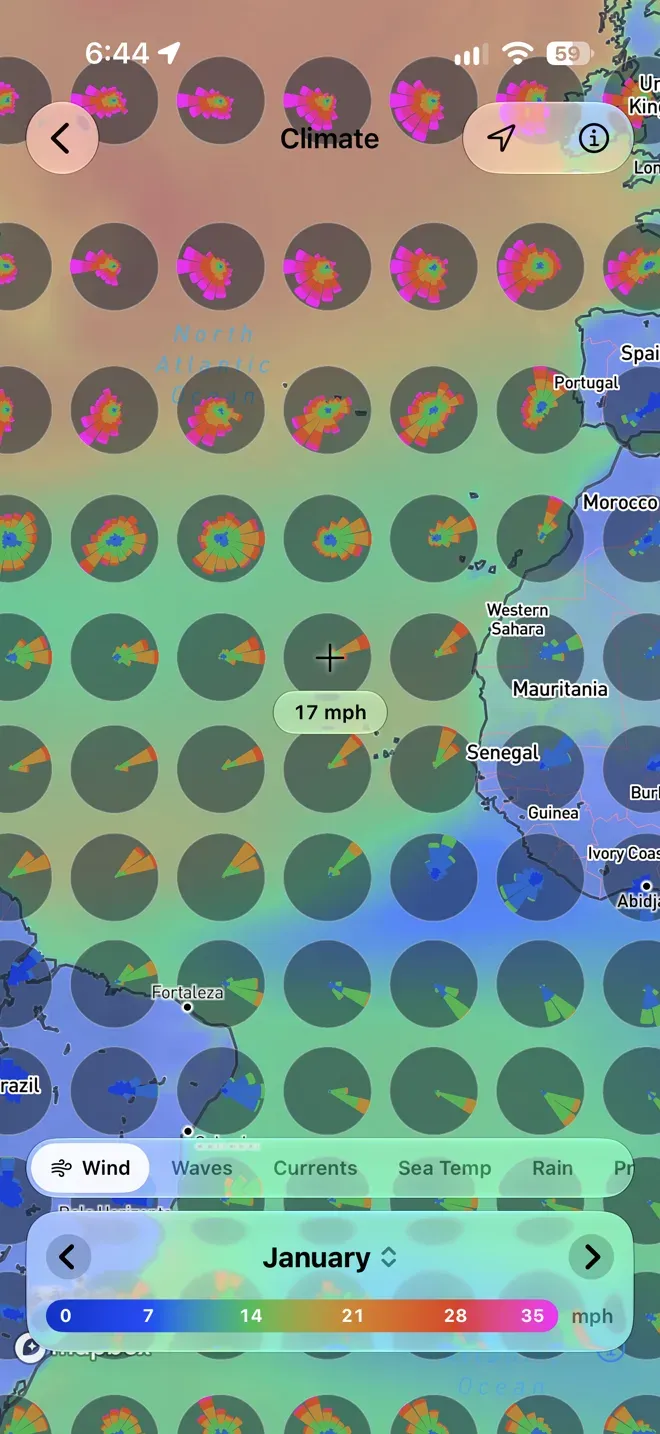
The crosshair in the middle of the map reads the layer’s average under it, like 12 kts or 62 mm. Pan the map to read another place.
Pick the month#
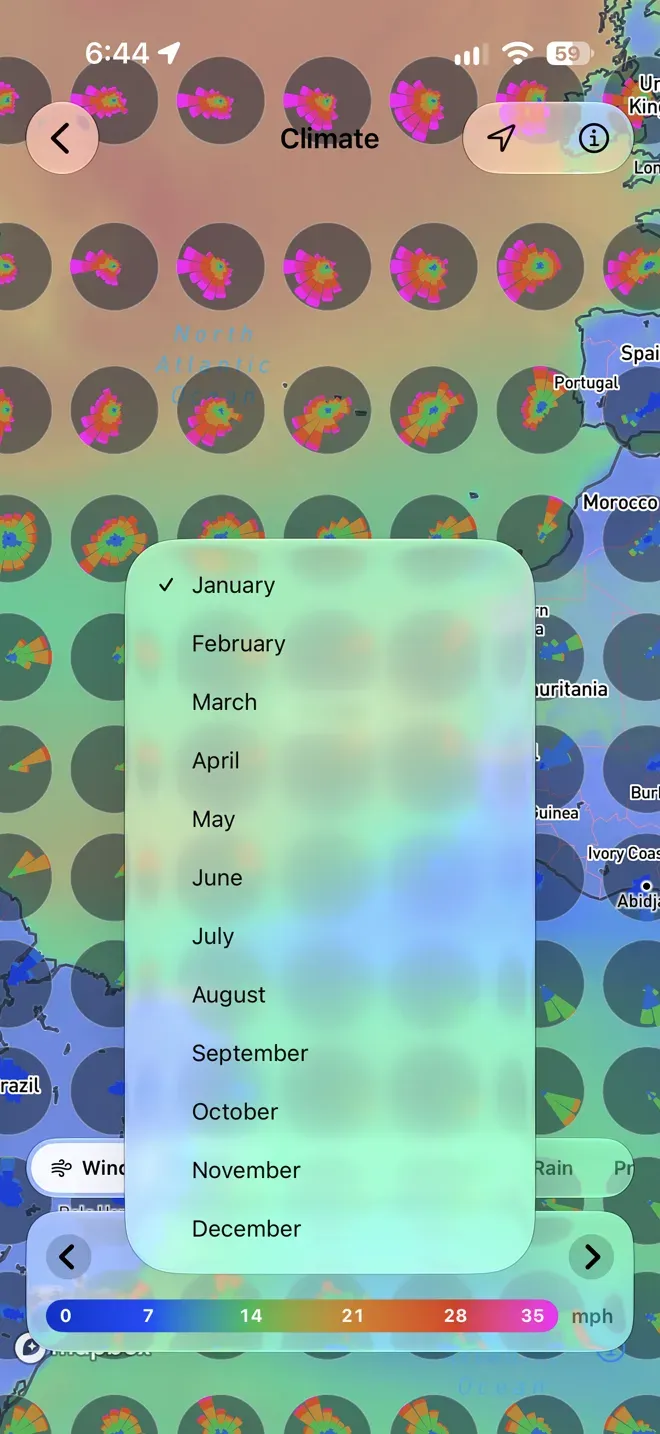
Tap the arrows in the card at the bottom to step a month, or tap the month’s name to choose one from the list.
A place’s details#
Tap anywhere on the map for a larger rose and the month’s numbers there:
- Wind or Waves, and for waves Height or Period.
- In the middle of the rose, the average, and the direction it most often comes from with how often, like ENE 54%. The busiest petal reaches the ring; the others are as long as they are common. A direction that’s too rare for a petal is a dot.
- Under the rose, a bar splits the time by strength, with each band’s share.
- Time of Day: All Day, 9am–1pm, 1pm–6pm, or 6pm–9am, by the sun at that place. Sea breezes and afternoon storms show up here.
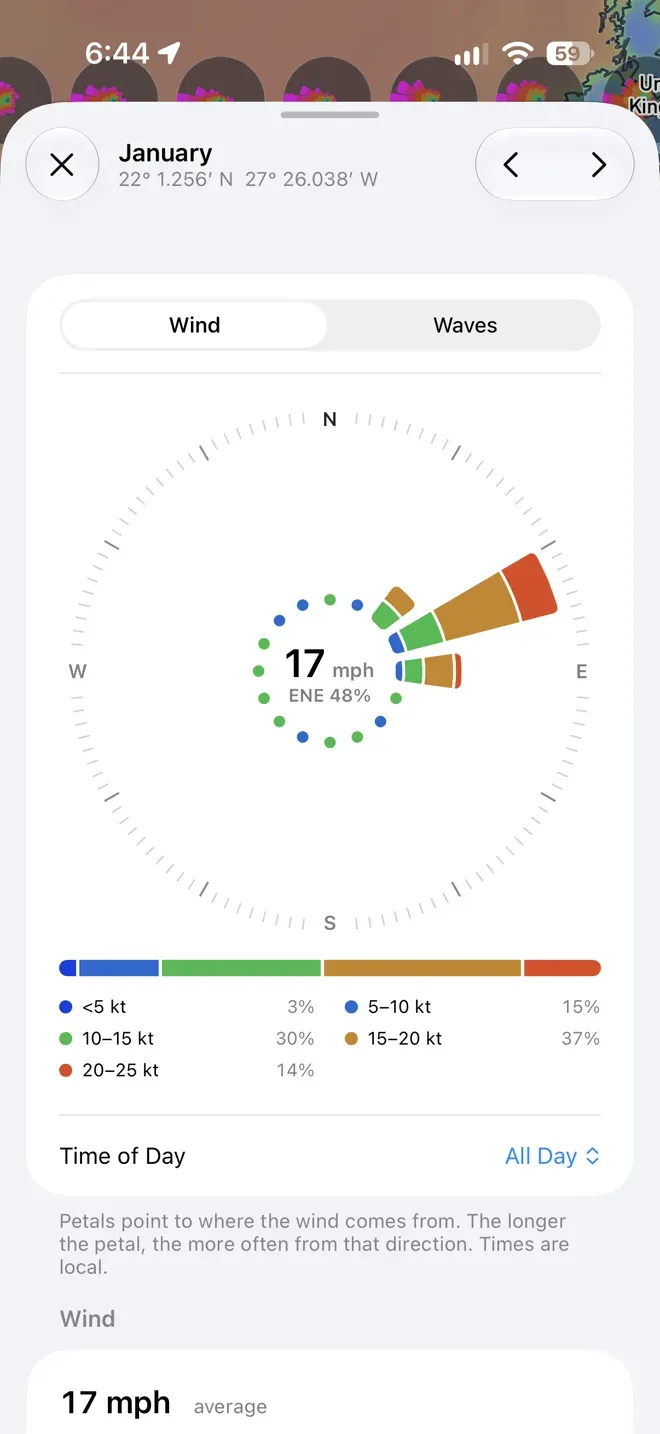
Under the rose, Wind, Sea, Rain, and Temperature each show the month’s value over a chart of the whole year, with this month picked out, so you can see how it compares to the others. Tap a month in any chart to switch to it.
- Wind: the average speed, the direction it most often comes from, average gusts, how often it blows a gale (34 knots and up), and pressure.
- Sea: average wave height and period, how often waves reach 4 m, the direction they most often come from, and the average current.
- Rain: the total for the month, days with rain, and days with thunderstorms.
- Temperature: the air and the sea through the year, and the daily high and low.
The arrows at the top step the month, and the map follows.
Connection#
Climate needs an internet connection.
- Couldn’t load… Check your connection: tap Try Again once you’re back online.
Elite#
Climate is part of OceanPulse Elite.