Weather Maps shows one forecast layer at a time across the whole world, animated over the next 72 hours. In the app it’s called Maps.
Open Maps#
In the sidebar, under Forecast, tap Maps. The first time you open it, it centres on your location. To get there in one tap, add Maps to your Favorites on Home.
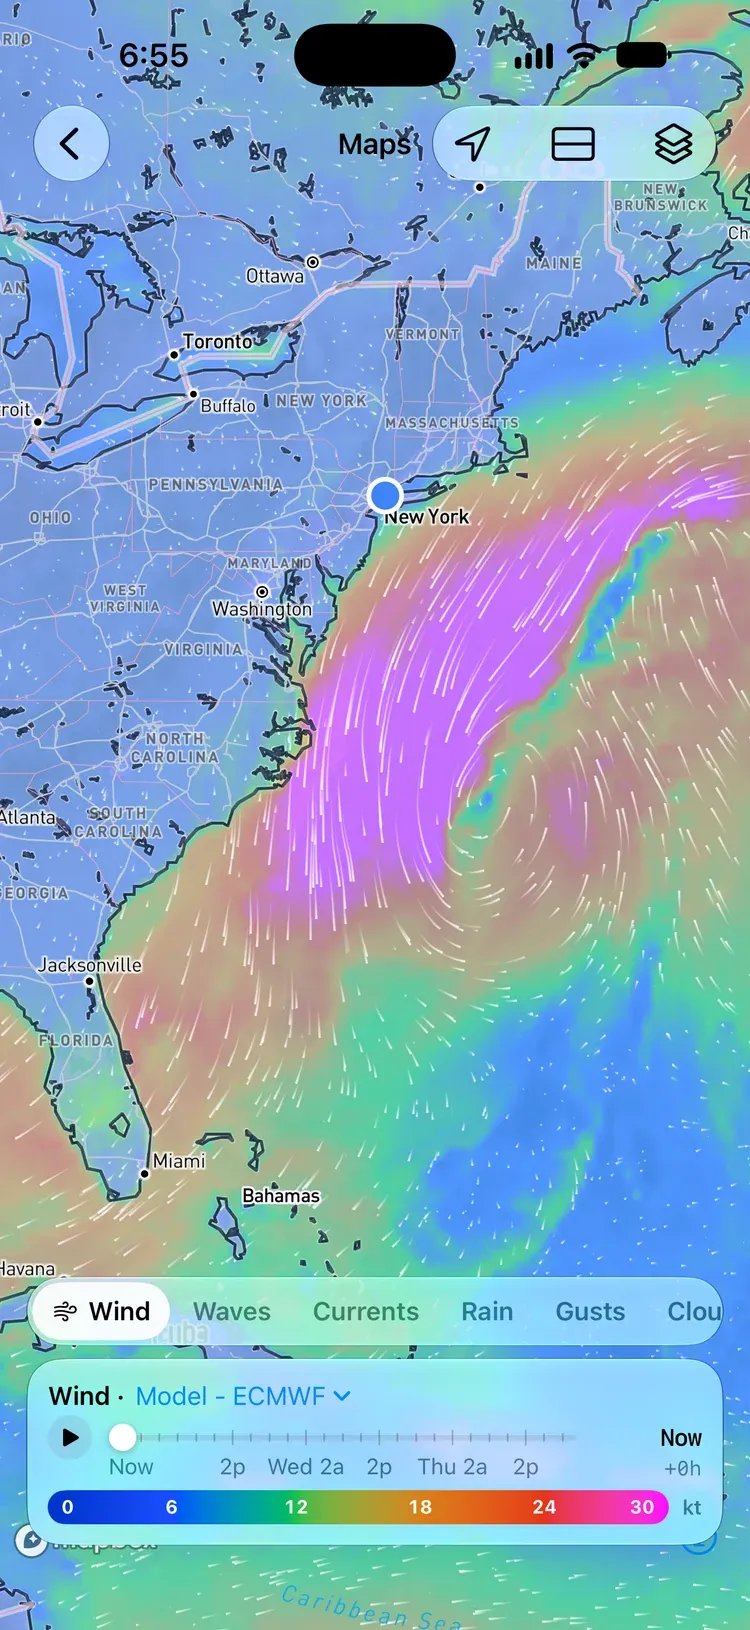
Three buttons sit at the top right:
- Center on My Location flies the map to where you are.
- Split View shows two maps at once. See Compare in split view.
- Map Options holds the layer, model, and opacity settings. See Map Options.
Choose a layer#
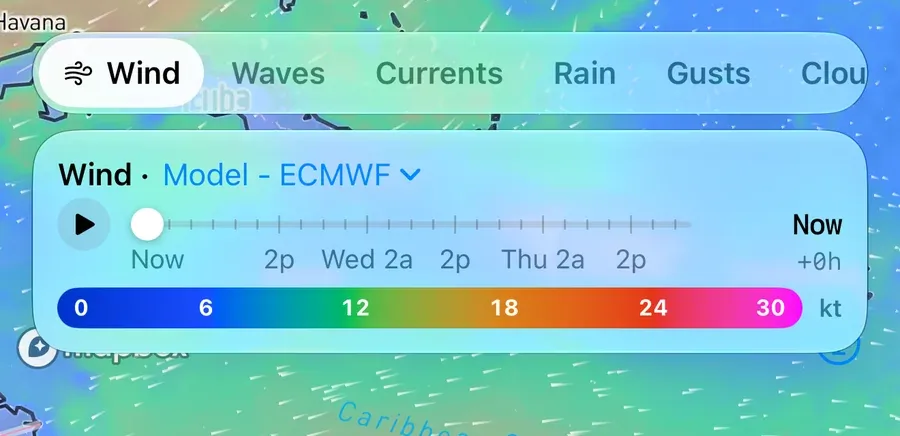
The strip along the bottom picks the layer. Swipe it sideways to see them all.
| Layer | Shows | Units |
|---|---|---|
| Wind | Wind speed | knots |
| Waves | Significant wave height (Pro) | metres |
| Currents | Ocean current speed (Pro) | knots |
| Sea Temp | Sea surface temperature (Pro) | °F or °C |
| Rain | Rain over each three hours | mm or in |
| Gusts | Wind gusts | knots |
| Cloud | Cloud cover | % |
| Air Temp | Air temperature | °F or °C |
| CAPE | Energy available for thunderstorms (Pro) | J/kg |
Speeds are always in knots, and wave heights in metres on Maps; rain and temperatures follow your unit settings.
Read the map#
- Color is the layer’s value. The scale under the timeline shows what each colour means.
- Moving white lines trace the flow: the wind on most layers, and the water on Currents. On Gusts, Rain, Cloud, Air Temp, and CAPE they still follow the wind, so you can see what’s carrying the weather. Sea Temp is colour alone.
- Sea Temp’s colours fit the water on screen. Pan or zoom, and the scale stretches over the temperatures in view, so a few degrees off the coast show as clearly as an ocean’s. The numbers on the scale change to match.
- Waves are drawn as short white crests lying across their direction of travel. They’re thicker for bigger waves and closer together for shorter periods.
- Hatching marks areas a model doesn’t cover. GFS Wave, for example, stops at 52.5°N.
Move through time#
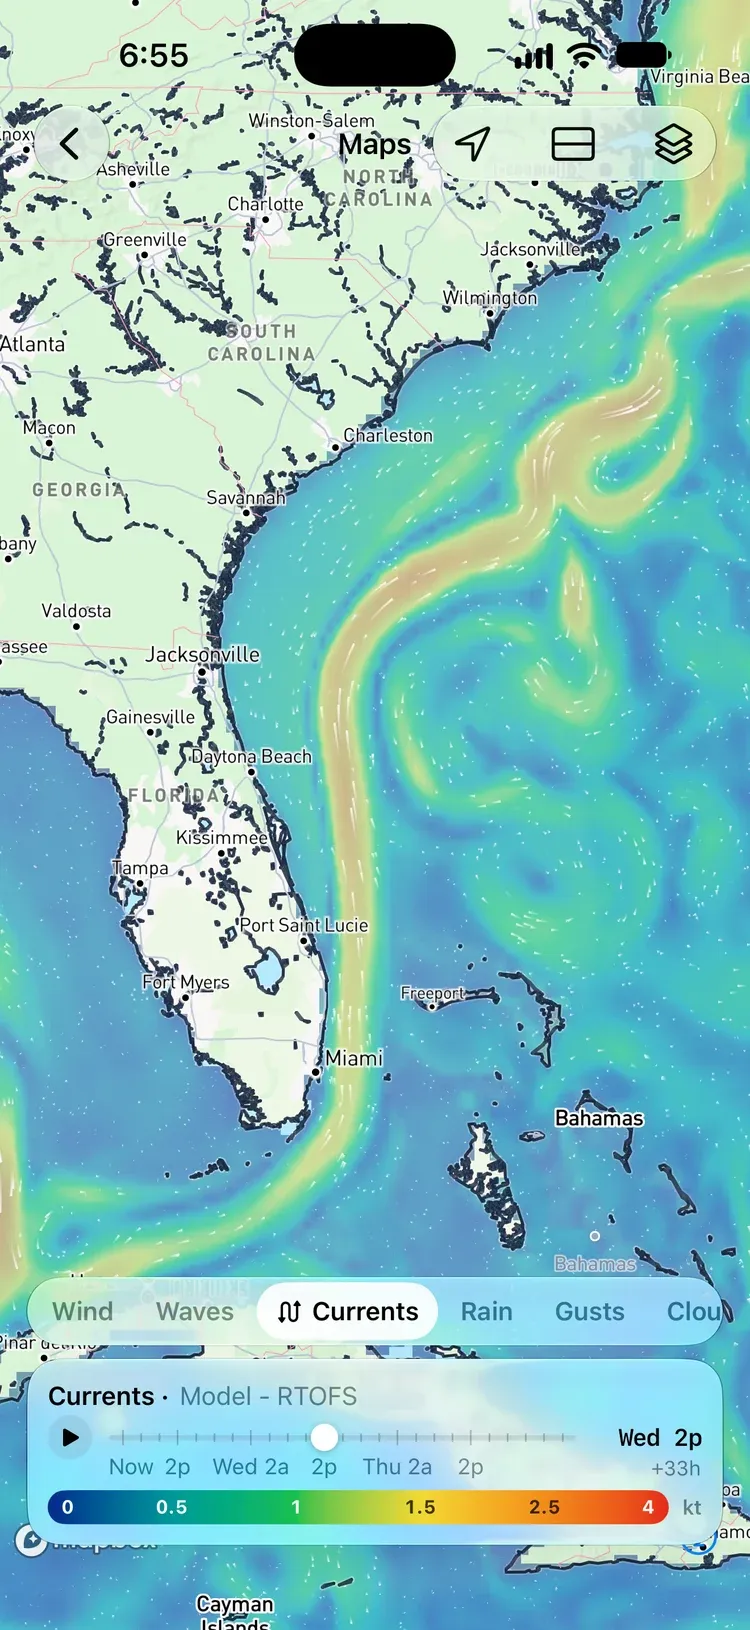
The timeline covers the next 72 hours in three-hour steps (six-hour steps on AIFS).
- Drag the handle to pick a time. The readout on the right shows the day and time, and how far ahead it is, like +33h.
- Tap play to animate the forecast. It loops back to the start.
Changing the layer or the model keeps the time you picked.
Sea Temp on Blended has no timeline: it’s one day’s satellite measurement, not a forecast. Map Options says which day it’s from. Switch the model to RTOFS for NOAA’s forecast.
Switch the forecast model#
Tap Model in the timeline’s header to choose whose forecast you’re looking at. Each model in the menu shows its provider underneath.
- Wind, Gusts, Rain, Cloud, Air Temp, and CAPE: GFS (NOAA), ECMWF, and AIFS (ECMWF’s AI model). AIFS doesn’t forecast gusts or CAPE.
- Waves: GFS Wave (NOAA), ECMWF WAM, and MFWAM (Copernicus Marine).
- Currents: RTOFS (NOAA), ECMWF Ocean, and Mercator (Copernicus Marine).
- Sea Temp: Geo-Polar Blended (NOAA), the measured sea temperature, updated daily from satellites, buoys, and ships; and RTOFS (NOAA), the forecast. Maps opens on Geo-Polar Blended.
OceanPulse remembers the model you pick for each layer across the app, so the chart’s weather overlays open on it too.
Compare in split view#
Tap Split View to show two maps at once: one above the other on iPhone, side by side when the screen is wider than it is tall.
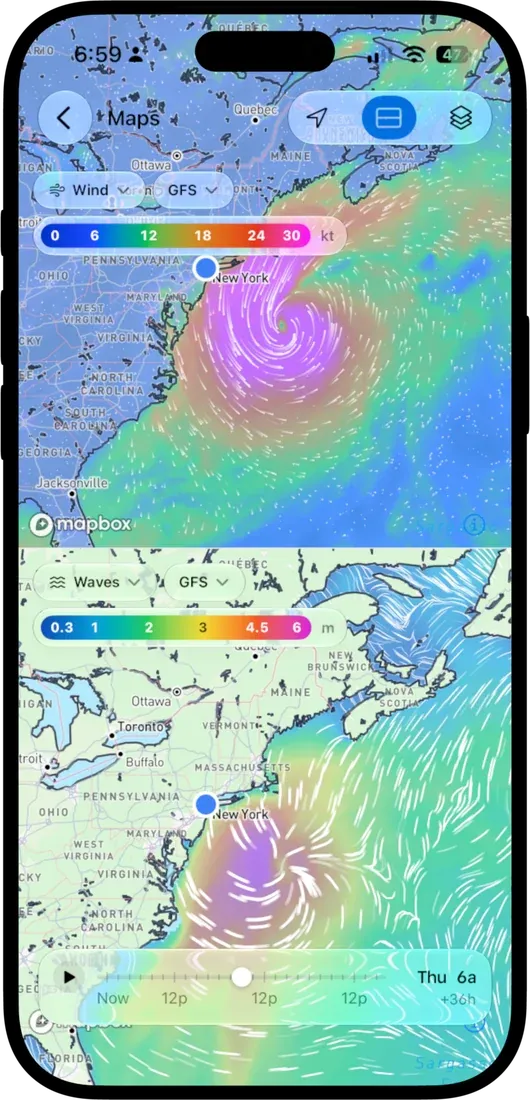
- Each pane has its own chips along its top for the layer and the model, with that pane’s colour scale.
- The second pane opens on Waves. Put the same layer in both panes to compare two models; OceanPulse picks a different model for the second pane for you.
- One timeline drives both panes, and moving either map moves the other. Sea Temp on Blended stays on its day while the other pane moves.
Tap Split View again to go back to one map.
Map Options#
The Map Options button opens a panel with:
- every layer, as a grid
- the model for the current layer
- Opacity, from 10% to 100%, to see more of the map under the weather
- on Sea Temp’s Blended model, the day it was measured
- in split view, whether the panes sit Top/Bottom or Left/Right
Close it with its X, the button again, or a tap on the map.
Pro layers#
Wind, Gusts, Rain, Cloud, and Air Temp are free on every model. Waves, Currents, Sea Temp, and CAPE are part of OceanPulse Pro and carry a PRO badge; tap one to see what Pro includes.
Maps and the chart’s weather overlays#
Coastal Charts can lay wind, waves, currents, sea temperature, or radar over the nautical chart itself. Maps uses the same forecasts and color scales, and adds the Gusts, Rain, Cloud, Air Temp, and CAPE layers and split view. Use the overlays while you navigate and Maps for the bigger picture.
Maps show forecasts, apart from Sea Temp’s measured Blended model. For rain falling now, use Rain Radar.
Battery and connection#
To save battery, the animation slows down in Low Power Mode or when your device is warm, and the lines rest while you pan or zoom.
On Android: the animation slows down under Battery Saver or when your phone is hot, and pauses if it gets very hot.
Maps needs an internet connection; forecasts aren’t stored on your device.
- Couldn’t load… Check your connection: tap Try Again once you’re back online.
- No data in this area: the model doesn’t cover the place you’re looking at. Try another model.