Tides & Currents predicts the tide and the tidal current at about 5,800 NOAA stations: the US Atlantic, Gulf, and Pacific coasts, Alaska, Hawaii, Puerto Rico, the US Virgin Islands, and US-affiliated Pacific islands. Predictions are worked out on your device, so they’re there with no signal at all. It’s part of OceanPulse Pro.
Open Tides & Currents#
In the sidebar, under Forecast, tap Tides & Currents. You can also get to a station from:
- Home: the Tides & Currents section shows the nearest tide station within 10 NM and the two stations you opened most recently. Tap a tile to open that station.
- Coastal Charts: tap a tide or current station on the chart, then Tide & Current Details. Search finds stations by name too, and the Nearby row lists stations within 10 NM.
Find a station#
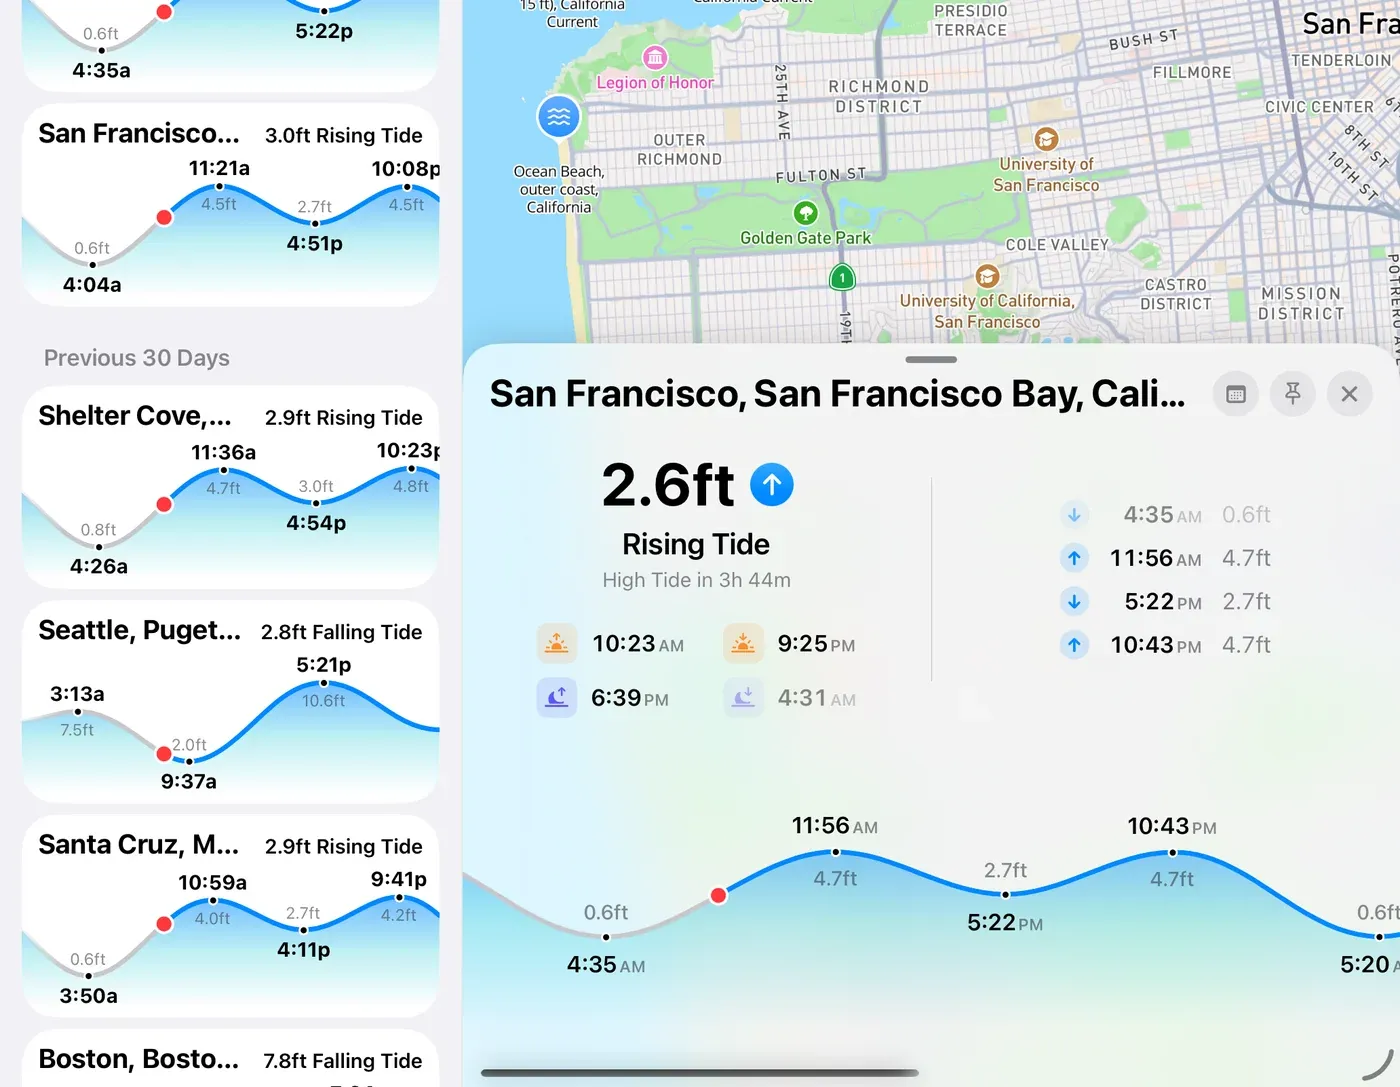
- Search for a station: type any part of its name.
- Choose on Map: at the top of the list. It opens a map of every station; tap one to open it. Zoomed out, stations gather into numbered clusters; tap a cluster to zoom in.
- Your list holds the stations you’ve opened, newest first, with pinned stations at the top. Each card shows the reading right now, like 1.6ft Rising Tide, over today’s curve.
- Pin a station: press and hold its card and choose Pin, or tap the pin button on the station.
- Sort: tap the … button to sort by date viewed or by station name, and to group by date.
On iPhone, the Map button at the top opens the station map. On iPad the map sits beside the list, and a station opens as a card along the bottom of the map; swipe it down or tap its grabber to fold it away.
On Android: on a phone, Map at the top opens the station map, and tapping a station opens it as a card along the bottom, as on a tablet. Press Back to close the card.
Current stations’ names end in Current. Tides rise and fall; currents flood, ebb, and go slack.
Read a station#
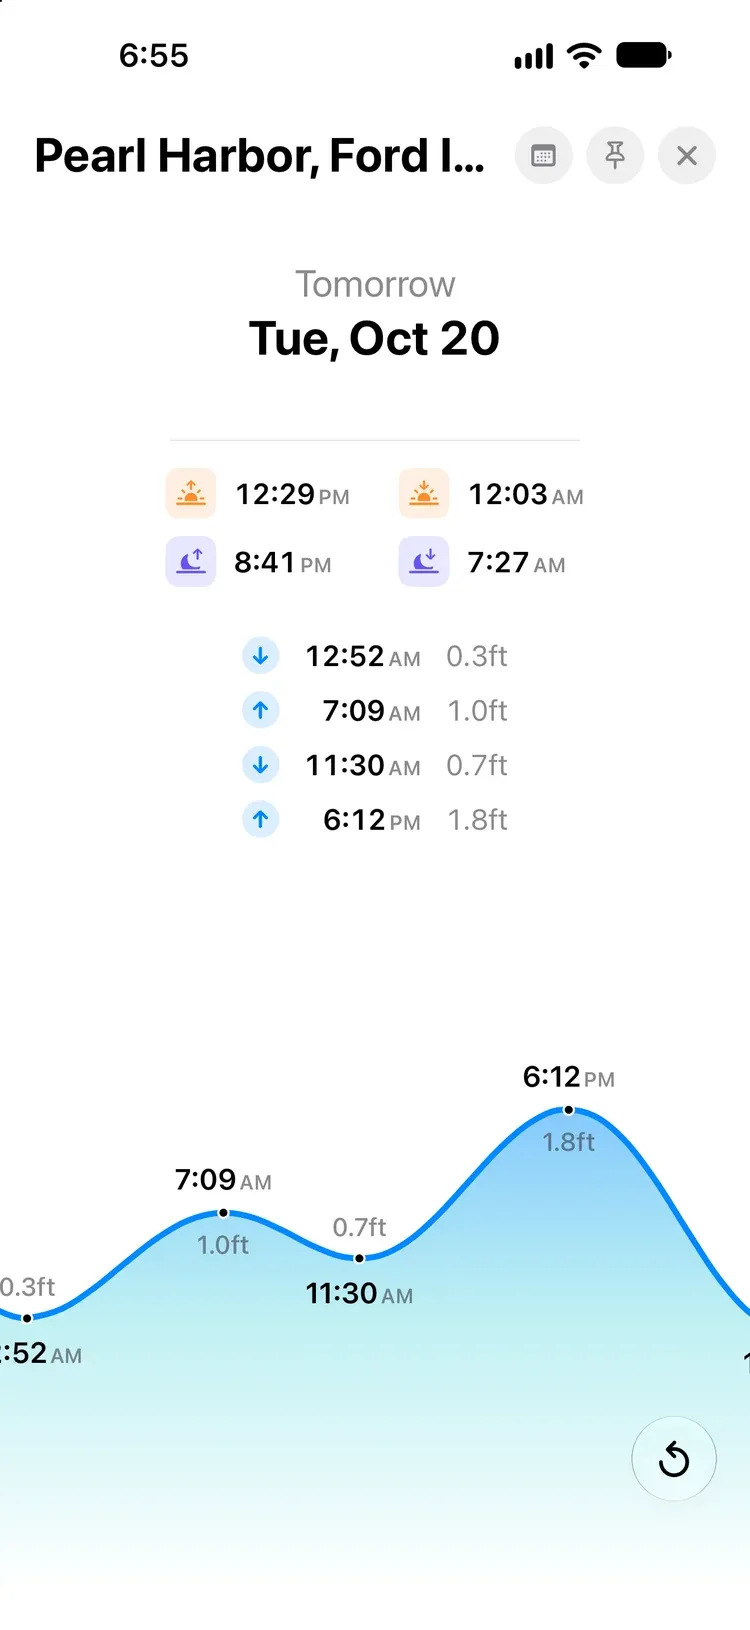
From the top:
- Right now: the height or speed now, whether it’s Rising, Falling, Flooding, Ebbing, or Slack, and the next event, like High Tide in 2h 5m.
- Sun and moon: sunrise, sunset, moonrise, and moonset. A dash means there isn’t one that day.
- The day’s events: High Tide and Low Tide with their heights, or for a current station Max Flood, Max Ebb, Slack, Ebb Begins, and Slack, Flood Begins with their speeds.
- The curve: a day at a time, with each high and low labeled and a red dot at now. Scroll it sideways through the days around today. If now scrolls off the screen, tap Recenter on now to jump back.
To look further ahead or back, tap Choose Date (the calendar button) and pick any day from 2000 to 2099.
Times on the station screen are in your device’s time zone. When you open a station from the chart and its time zone is different from yours, the chart’s details card shows both.
Tide heights are measured from Mean Lower Low Water, the same datum US charts use for soundings.
Units#
Heights and speeds follow your units. Open the … Settings and Support menu, choose Units, and set Depth (feet, metres, or fathoms) and Speed (knots, mph, or km/h).
Tides on the chart#
On Coastal Charts, zoom in on a harbor and each station’s icon shows the reading right now. Tide icons fill as the tide comes in and are colored for rising or falling; current arrows turn to point the way the water’s flowing. They automatically update every 10 minutes if you remain on the chart screen.
Offline#
Every prediction is worked out on your device from NOAA’s tidal data, which comes with the app. Your list, search, and every station work with no connection. The station globe/map background needs a connection.
Predictions aren’t a substitute for official tide tables.
Pro#
Tides & Currents is part of OceanPulse Pro.