Tables & Graphs shows ten days of forecast for one place as a grid. Time runs left to right, and each row is one kind of weather property. Where several forecast models cover a row, you can compare them line by line.
Open a forecast#
In the sidebar, under Forecast, tap Tables & Graphs. Below Choose on Map, the list shows My Location, followed by the places you’ve saved. Tap one to open its table.
- Add a place: type a town or city into Search for a place, or tap Choose on Map and pick any point, out on the water included.
- Remove or reorder places: swipe left on a place to delete it, or tap the … button and choose Edit List.
Daily Summary and Solunar share this list, so a place you add in one shows up in all three.
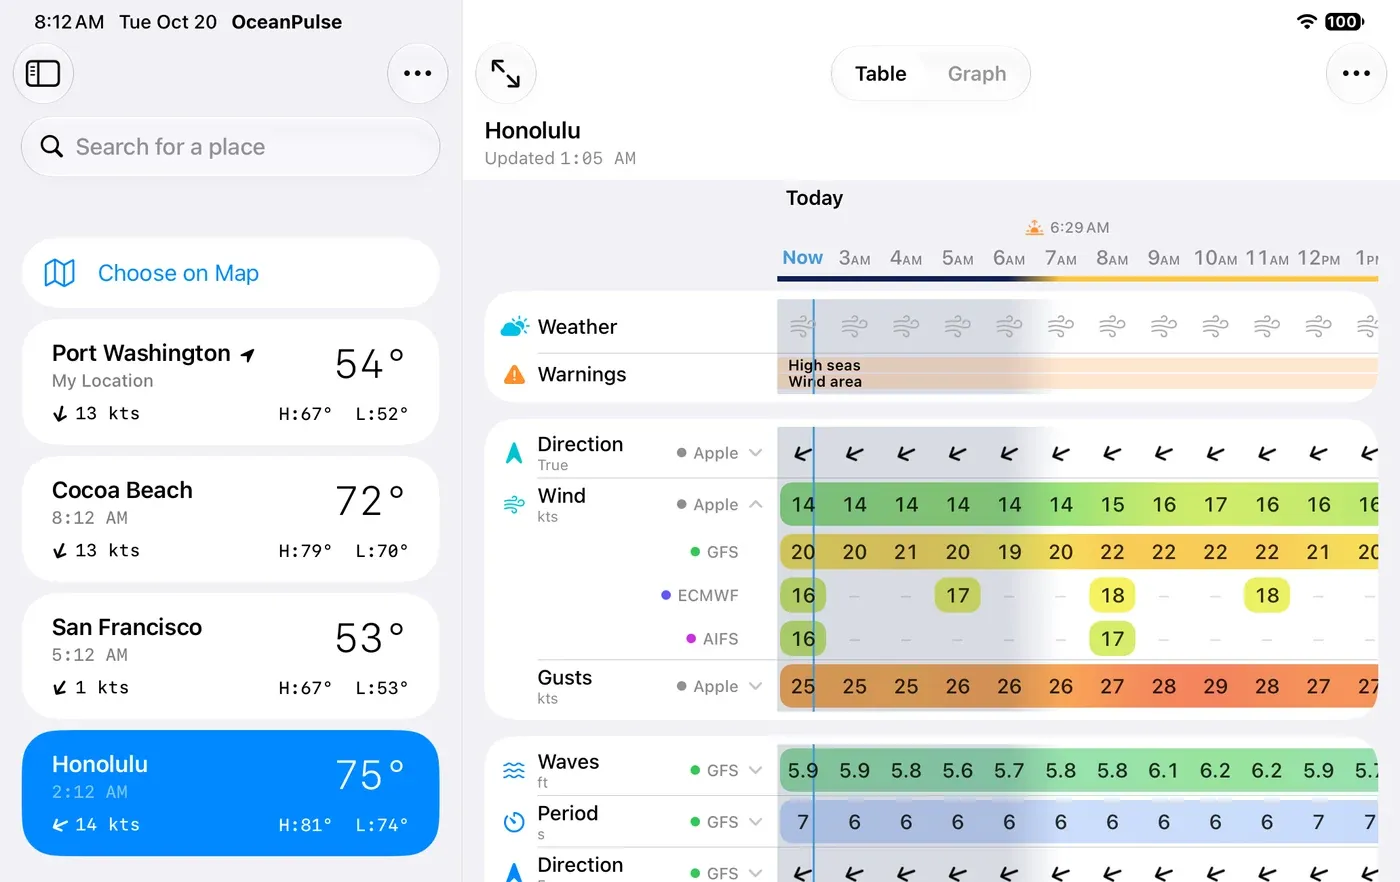
The same table opens from other parts of the app too:
- Home: tap the Weather card for the forecast where you are.
- Coastal Charts: press and hold anywhere on the chart, then tap Weather.
- A marker: open it and tap Forecast.
Read the table#
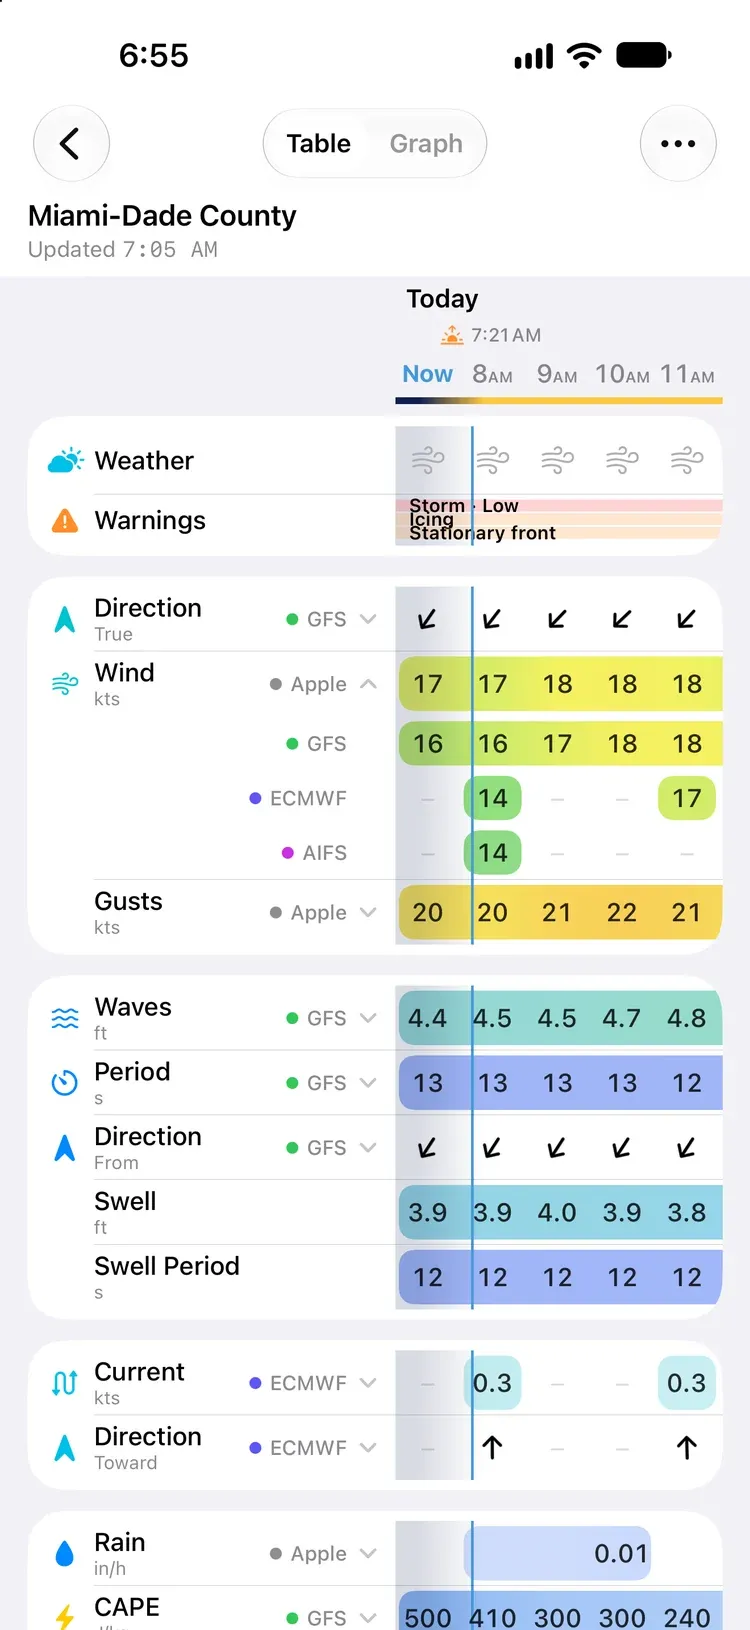
- Columns are hours. The table opens at the current hour, labelled Now, with a line marking the current minute. Scroll sideways for up to ten days. The day (Today, Tomorrow, then the weekday) stays pinned at the left edge as you go.
- Sunrise and sunset sit above the hours, and night hours are shaded down the whole grid.
- Rows are grouped into cards:
| Card | Rows |
|---|---|
| Conditions | Weather, Warnings |
| Wind | Direction, Wind, Gusts |
| Sea | Waves, Period, Direction, Swell, Swell Period, Sea Temp |
| Currents | Current, Direction |
| Sky | Rain, CAPE, Cloud Cover |
| Air | UV Index, Temperature, Pressure, Visibility |
The Sea and Currents cards only appear where there’s water data for the place.
The hours stay pinned at the top as you scroll down. Scroll right and the row names slide away, replaced by a narrow column of icons and model initials.
Colours, arrows, and blanks#
- Colour shows strength at a glance. Wind runs from blue in light air, through green at about 14 knots, yellow at 18, orange at 24, and red at 30, to magenta past 40. Waves go from blue to green at 2 m (6½ ft), yellow at 3 m (10 ft), orange at 4.5 m (15 ft) and violet past 6 m (20 ft). Rain, CAPE, cloud, UV, air and sea temperature, pressure, and fog are shaded too.
- Arrows point the way things are moving. An arrow pointing down in the wind row is a north wind, blowing south. The small label under each Direction row is how that direction is usually quoted (wind against True north, waves by where they come From, current by where it flows Toward), but the arrows always show the direction of travel.
- Pressure carries a small arrow when it’s rising or falling.
- A blank cell means there’s nothing to flag: calm, dry, clear, or steady.
- A dash (–) means that the model has no value for that hour. Some models only forecast every three or six hours, so the hours in between are dashes.
Compare forecast models#
Each row names the model it’s showing, with a colored dot beside the row’s label. When more than one model covers a row, a chevron appears next to the name.
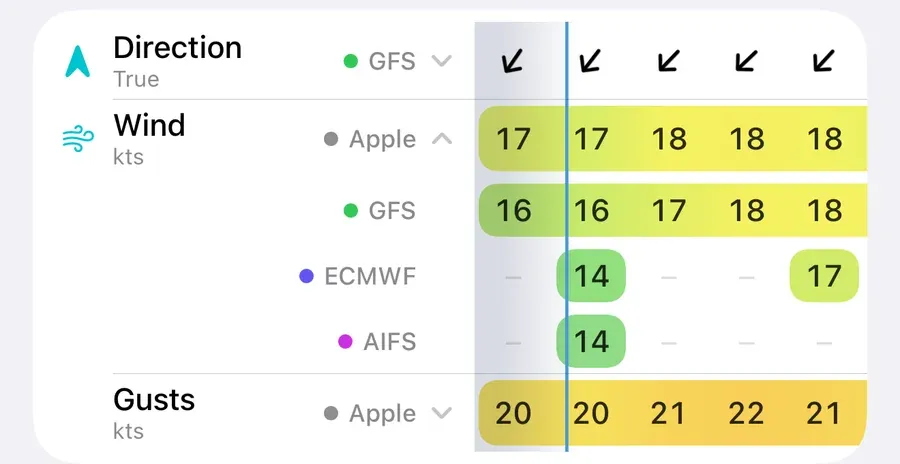
- Tap the row to expand it into one line per model, so you can see where the forecasts agree and where they don’t.
- Tap a model’s line to collapse the row onto that model. OceanPulse remembers the pick.
- Wind opens expanded until you pick a model for it.
| Model | From | Forecasts |
|---|---|---|
| Apple | Apple Weather | Weather icons, wind, gusts, rain, cloud, UV, temperature, pressure, visibility |
| GFS | NOAA | Wind, gusts, waves, swell, rain, CAPE, cloud, temperature |
| ECMWF | ECMWF | Wind, gusts, waves, currents, rain, CAPE, cloud, temperature |
| AIFS | ECMWF’s AI model | Wind, rain, cloud, temperature |
| RTOFS | NOAA | Currents, sea temperature |
| Mercator | Copernicus Marine | Waves, swell, currents |
| Blended | NOAA | Sea temperature, measured daily by satellite |
Blended (Geo-Polar Blended) isn’t a forecast: it’s the latest day’s measured sea temperature, so the same value runs across today’s hours.
A note under the table explains anything unusual about the numbers, such as hours filled in between a model’s forecast steps, or the day Blended measured.
Customize the table#
Tap the … button at the top right, then Customize Table:
- Interval: Every Hour, or Every 3 Hours, which shows the average over each three hours.
- Rows: switch off the rows you don’t need, card by card.
- Models: switch a model off, and it leaves every row. The Weather row’s icons come from Apple, so hiding Apple hides them too.
The last row or model can’t be switched off. Your choices are saved with your unit settings, so they follow you to your other devices through iCloud, and the chart’s Weather sheet uses them too.
On Android: your choices stay on the phone or tablet; they don’t follow you to your other devices.
Units apply across the whole app. Open the … Settings and Support menu and choose Units to switch between knots and mph, feet and metres, °F and °C, and so on.
Warnings#
The Warnings row shows the marine alerts in force around the place, such as a gale warning or a front. Tap the row for the full Marine Alerts list.
Pro rows#
CAPE, the Sea rows, and the Currents rows are part of OceanPulse Pro. Without Pro they show a PRO badge; tap one to see what Pro includes. Everything else in the table is free, on every model.
Updates and connection#
The line under the place name says when the forecast was last updated. When you open a table whose forecast has expired or is more than 30 minutes old, OceanPulse fetches a fresh one on its own.
The table needs an internet connection; forecasts aren’t stored for offline use. If one can’t load, you’ll see Forecast Unavailable. Tap Try Again once you’re back online.