Coastal Charts is OceanPulse’s nautical chart: official chart data for the US, the Great Lakes, US territories, and the major inland rivers, drawn sharp at every zoom. It’s where you navigate, mark your spots, plan routes, record tracks, and check the weather on the water.
Open Coastal Charts#
In the sidebar, under Tools, tap Coastal Charts.
On iPhone the chart has a sheet along the bottom; drag it up for more. On iPad, and on iPhone held sideways, the same controls sit in a panel on the left.
On Android: a phone shows the sheet, and a tablet or a phone held sideways shows the panel. Press Back to step back through the sheet’s pages.
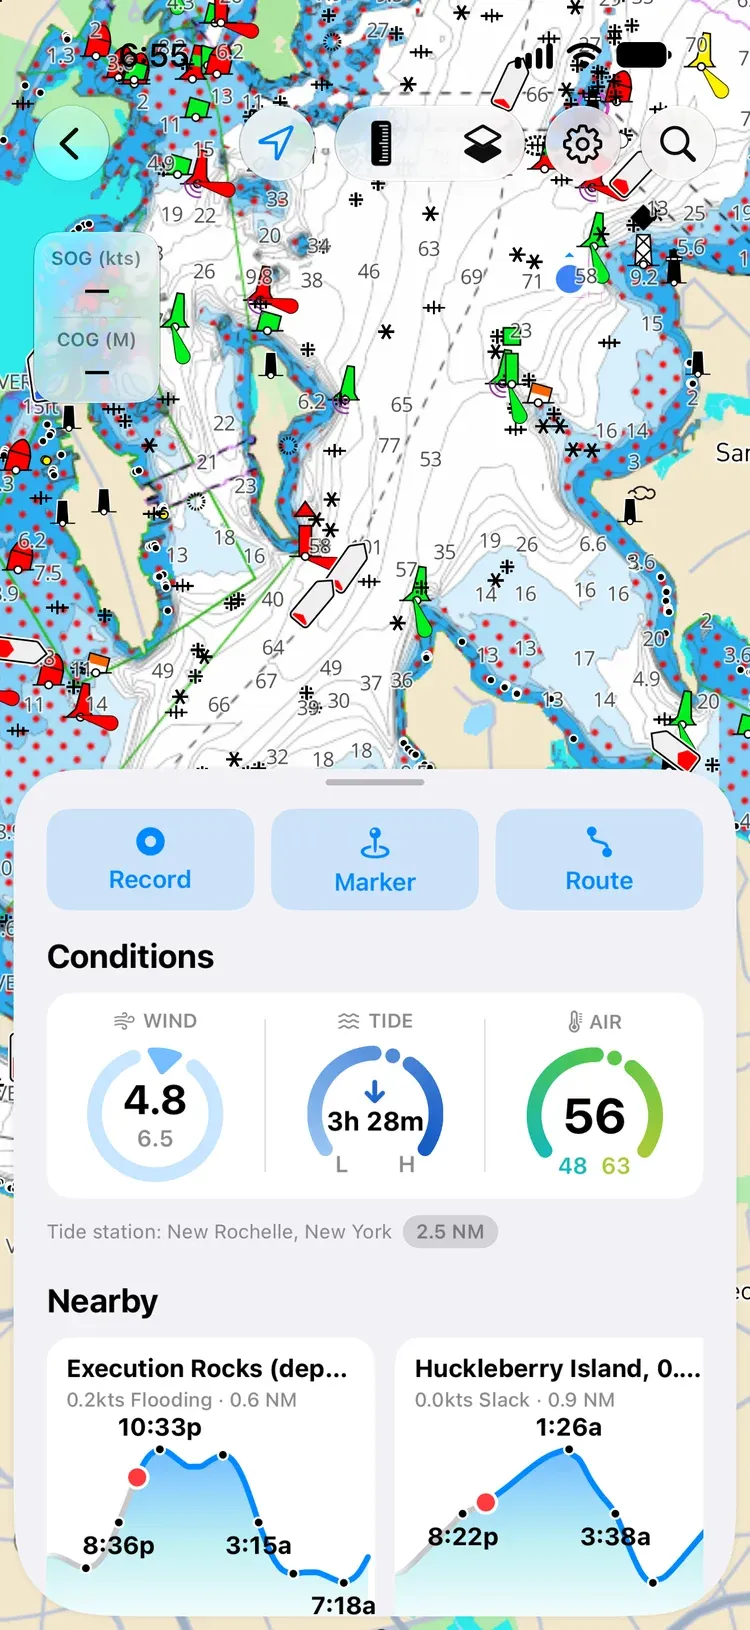
The buttons along the top of the chart:
- GPS centres the chart on you. See Follow your position.
- Caliper (the ruler) measures distance and bearing. See Measure.
- Map Layers picks the chart’s look and a weather overlay.
- Settings holds offline charts, your markers and routes, and chart display.
- Search finds places, harbors, marinas and anchorages, your own markers, routes, and tracks, and tide stations. Depending on your device orientation or screen size, the search bar will be a button or a text field.
On Android: the search bar is always a button; tap it to type.
The sheet#
- Record, Marker, and Route start a track, a marker, or a route.
- Conditions shows the wind, the tide (with Pro), and the air temperature where you are, with the tide station it’s using.
- Nearby lists marinas, anchorages, and tide stations within 10 NM, from Waterway Guide.
- Library opens your saved Waypoints (markers), Routes, and Tracks.
Conditions and Nearby need permission to use your location.
Read the chart#
The chart shows soundings in your depth unit, depth shading, buoys and beacons, lights, wrecks, landmarks, bridges with their clearances, marinas and anchorages, and tide and current stations.
On the inland rivers (the Mississippi, Ohio, Tennessee, Illinois, Missouri, Arkansas, and more) the chart comes from the US Army Corps of Engineers: the channel, river-mile markers, lights and beacons, dams and lock gates, bridges with their clearances, and wing dikes. River charts have no soundings. Their depth shading marks where the river is shallower than 9 ft, measured from the river’s low-water reference level rather than a tidal datum, so the depth you actually find is usually more.
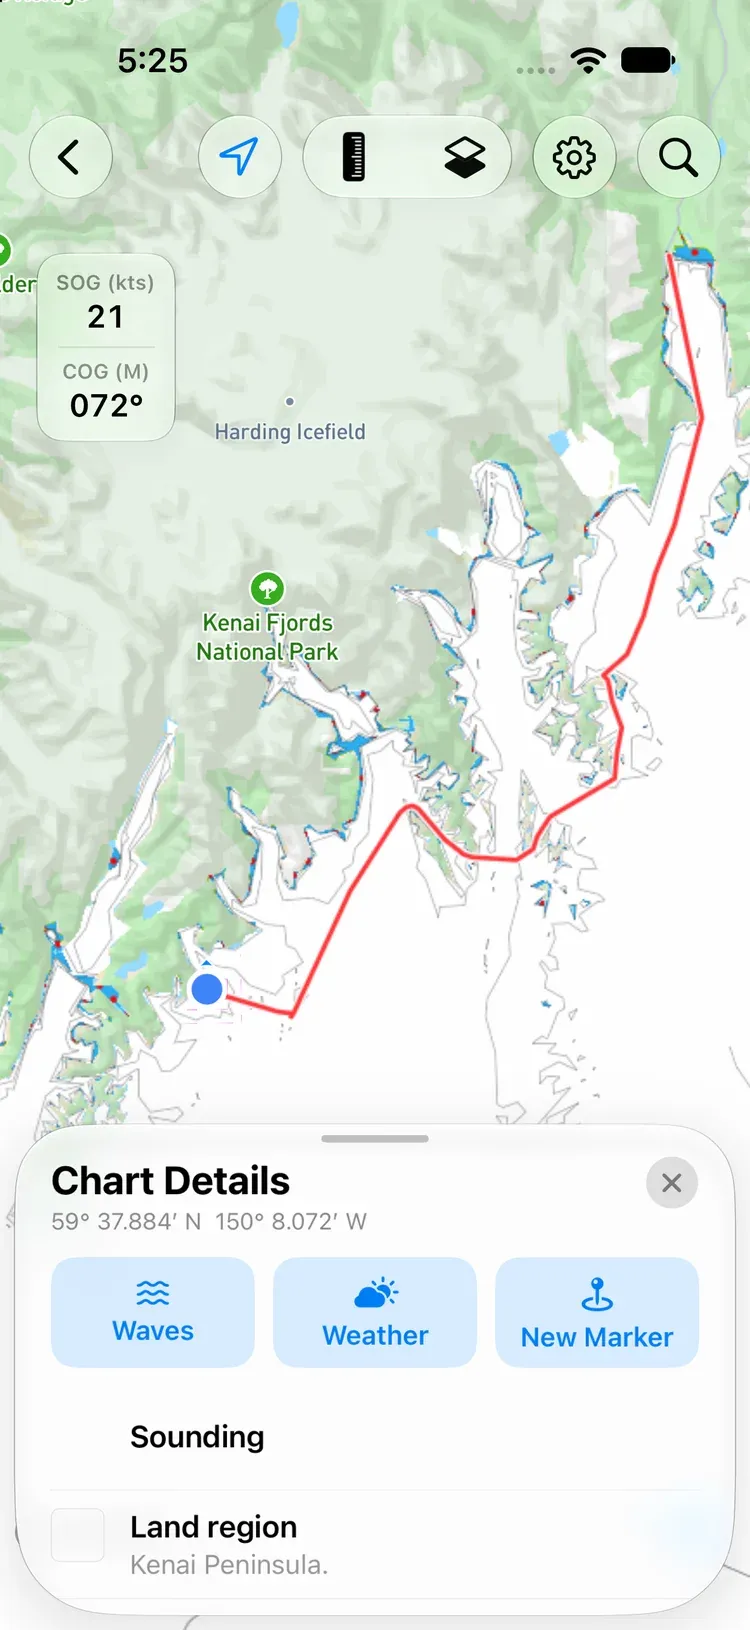
Tap anything on the chart for Chart Details: the position, and a plain-English description of every chart object at that spot, from a buoy’s color and light to a wreck’s depth. From there you can drop a marker, or with Pro open the waves and weather for that point.
Depth shading and safety depth#
Tap Settings, then Chart Display, and set two depths for your boat:
- Depth Shading: shallow water is dark blue, getting lighter as it deepens. Water deeper than this depth is white.
- Safety Depth: water shallower than this is covered in red hatching, so it stands out at a glance.
Both run from 0 to 65 ft (or the same in metres). Chart Display is also where you turn Show saved tracks on or off.
The chart’s look#
Map Layers sets the Theme (Auto, Light, or Dark, for the whole app) and the Land Overlay (Roads or Satellite).
Follow your position#
Tap GPS to center the chart on you with north up. Tap it again for course up: the chart turns with you, and a line runs ahead along your course over ground. Pan away to look around and tap GPS to come back.
While the chart knows where you are, a small readout shows your SOG (speed over ground) and COG (course over ground).
Press and hold#
Press and hold anywhere on the chart for a quick menu:
- Marker drops a marker there.
- Measure shows the distance and bearing from you to that point.
- Weather opens the hour-by-hour forecast for that spot. See Tables & Graphs.
Measure#
Tap the Caliper to put a ruler on the chart. Drag either end to measure between any two points; the label shows the distance and the bearing.
Markers#
Drop a marker by pressing and holding the chart and choosing Marker, or tap Marker in the sheet and choose New Marker. Give it a title and a description. To place it exactly, use Set coordinates manually (decimal degrees, degrees and minutes, or degrees, minutes, and seconds), or press and hold the pin and drag it.
On Android: press and hold the pin until it lifts, then drag it. If your finger comes up first, the pin stays lifted for three seconds, so you can touch it again and drag.
A marker shows how far away it is, with these buttons:
- Go flies the chart to it.
- Share sends it as a web link, a GPX file, or its coordinates.
- Edit changes its title, description, icon, and color.
- Forecast opens the hour-by-hour forecast for that spot.
Find all your markers under Marker → Saved Markers, or Waypoints in the Library.
Routes#
Tap Route in the sheet, then New Route, and tap the chart to drop waypoints. Drag a waypoint to move it, and reorder or delete waypoints in the list. OceanPulse saves the route as you go; tap Rename to name it. A route needs at least two waypoints.
The summary shows the Total Distance, Estimated Time, and Fuel Burn, worked out from your boat’s cruise speed and fuel use. Set those under the … Settings and Support menu → Vessel.
Follow a route#
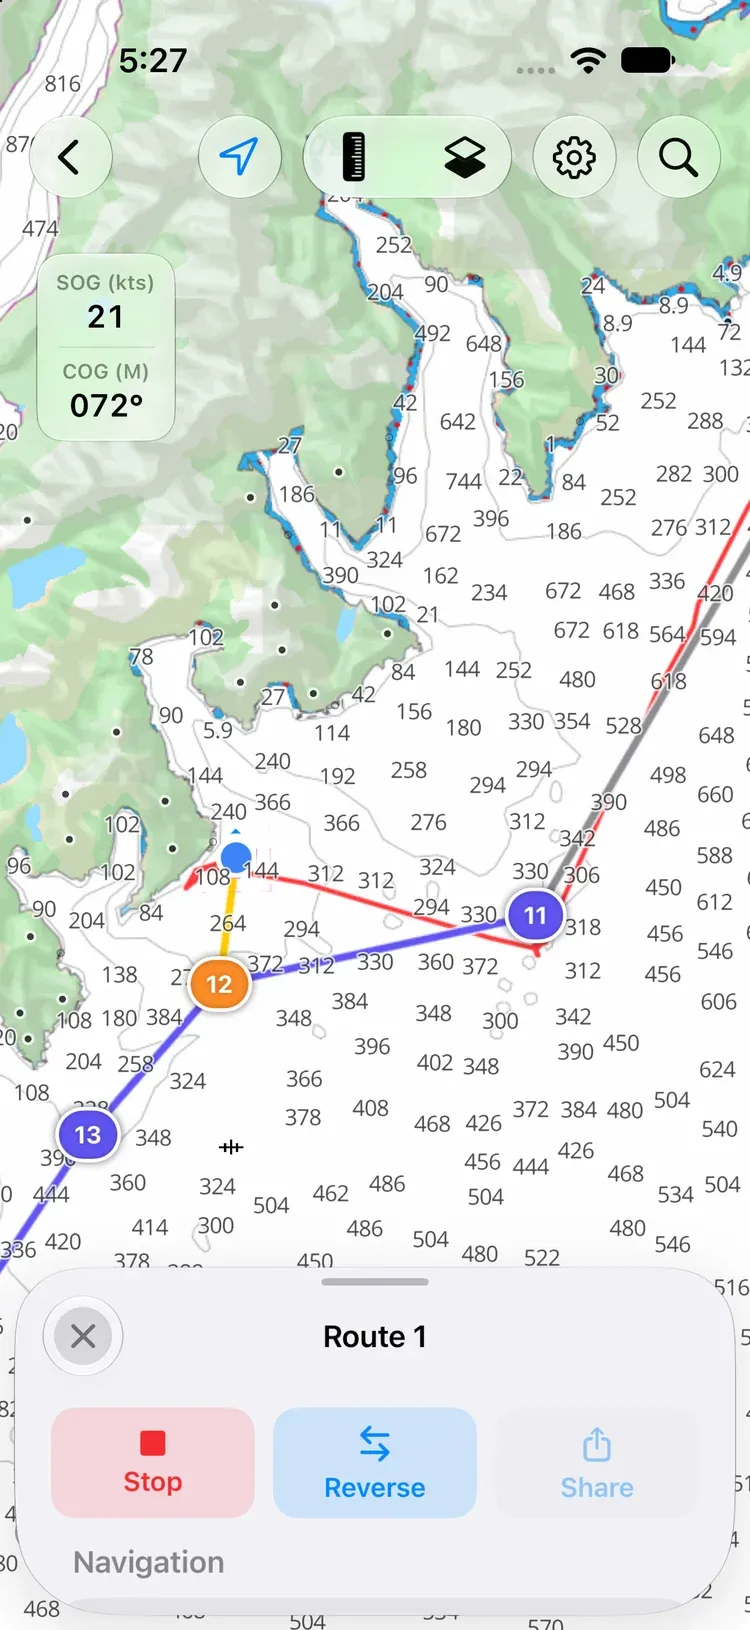
Tap Start. The route card shows Distance to Next, ETA to Next, Bearing to Next, Route Remaining, and Route ETA, and the sheet keeps the distance, bearing, and ETA to the next waypoint in view. ETAs use your actual speed made good, smoothed so a wave doesn’t throw them off.
- Reverse runs the route the other way.
- Navigate to this waypoint skips ahead.
- Stop ends navigation.
When you come within 100 m of the last waypoint, OceanPulse tells you you’ve arrived.
On Android: while a route is under way, a Navigating notification keeps your position coming with the screen off. Allow OceanPulse’s notifications to see it. On some phones you also need to let OceanPulse run in the background; see Battery settings.
Find saved routes under Route → Saved Routes, or Routes in the Library.
Weather on the chart#
Lay the weather right over the chart: tap Map Layers and pick a Data Overlay:
- Wind: speed and direction (free)
- Radar: rain and storms over the last four hours (Pro)
- Currents: surface flow (Pro)
- Waves: wave height and swell (Pro)
- Sea Temp: sea surface temperature (Pro)
One overlay shows at a time. Drag the timeline to look up to 72 hours ahead (radar looks back four hours instead), or tap play. Tap the model in the timeline’s header to switch forecast model. For more layers and a split view, see Weather Maps.
Sea Temp opens on Geo-Polar Blended, NOAA’s daily measurement, which has no timeline; the note under the Data Overlay list says which day it’s from. Pick RTOFS in the model menu for the forecast.
Offline charts#
Download charts before you lose signal:
- Tap Settings, then Offline Charts.
- Tap Download New Chart, and frame the area you want. The download size shows before you start; it takes about the same space on your device.
- Start the download. It keeps going in the background.
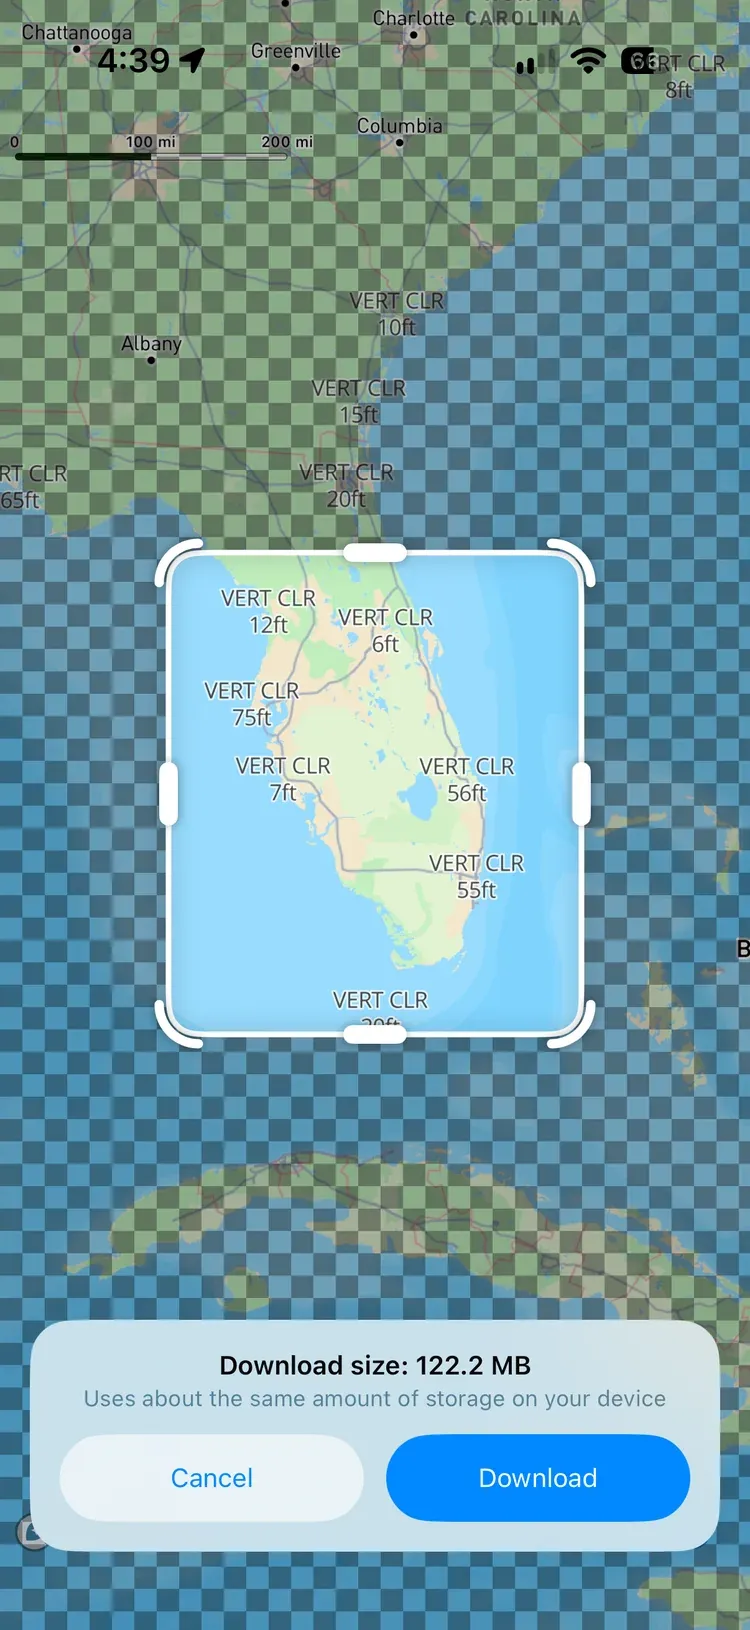
If part of a download fails, the chart shows Paused — tap to retry. When newer chart data is published, the chart shows Update available; tap Update, and the old one stays usable while it downloads.
On Android: a notification shows the download’s progress while it runs. If you stop it from Android’s list of active apps, the chart shows Paused — tap to retry. If it stops for another reason, such as the phone restarting, open OceanPulse and it carries on.
Turn on Only Use Offline Charts to see exactly what you’ve downloaded: everywhere else is hatched. Deleting a chart keeps any area another download still covers.
Offline charts hold the nautical chart itself. The roads or satellite background on land still needs a connection.
GPX and sharing#
Markers, routes, and tracks can be shared as GPX files, which work with chartplotters and other navigation apps, or as web links anyone can open. To bring a GPX file in, open it with OceanPulse from Files, Mail, Messages, or AirDrop.
On Android: open a
.gpxfrom Files, Gmail, Drive, or your downloads and choose OceanPulse, or share it to OceanPulse from another app. You can also tap Settings on the chart, then Import GPX under Library, and pick the file.
Units and your boat#
Open the … Settings and Support menu:
- Units: position format, depth, distance, speed, fuel, temperature, pressure, rain, and heading.
- Vessel: your boat’s cruise speed and fuel consumption, used for route time and fuel estimates.
Your markers, routes, tracks, and settings sync across your devices through iCloud.
On Android: the Settings and Support menu is ⋮ at the top right of Home. Your markers, routes, tracks, and settings are kept on the phone or tablet you made them on; see Your data.
Free and Pro#
Charts, markers, routes, tracks, offline charts, and the Wind overlay are free. OceanPulse Pro adds the Radar, Currents, Waves, and Sea Temp overlays, the waves and weather buttons in Chart Details, and the tide readings in Conditions and Nearby.