Tools · Climate
Pick the right month to go.
See what any month is usually like anywhere at sea, from the last ten years of weather. When the trade winds fill in, where gales are common, which way the swell runs, and how much rain to expect, so you plan the passage for its season.


Every month
Ten years, month by month
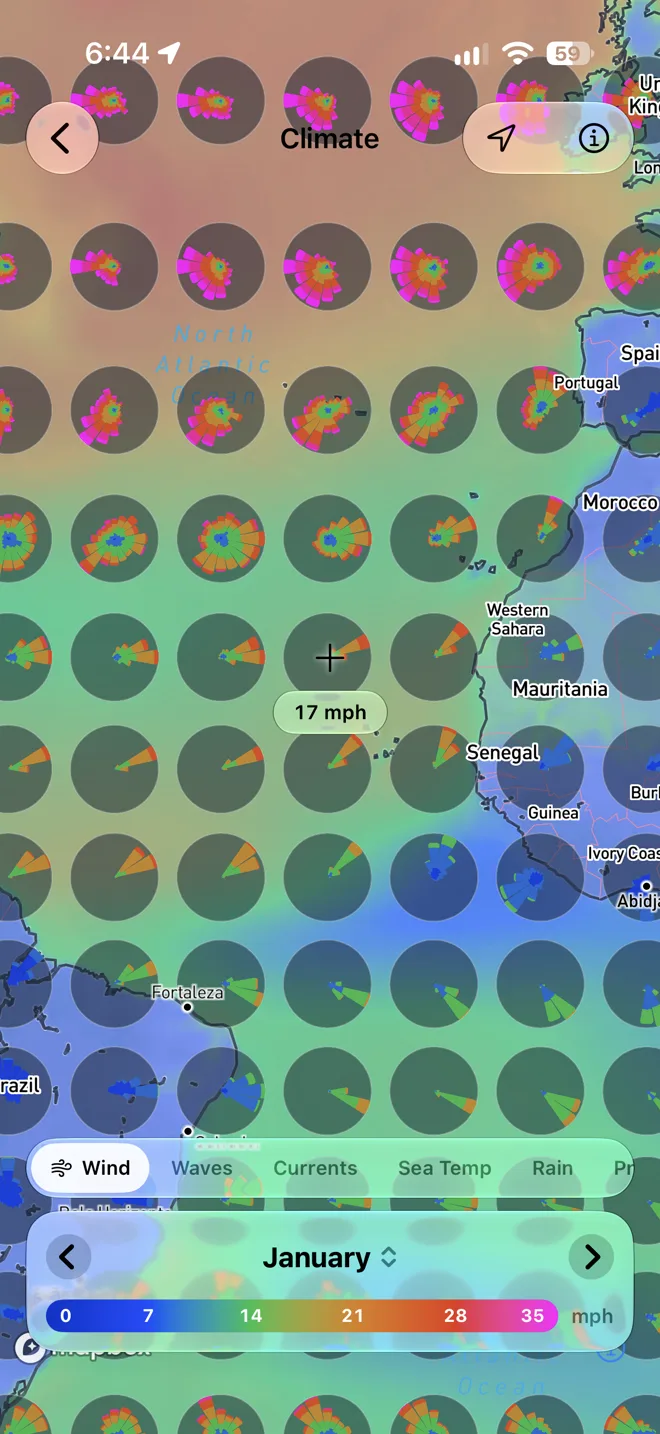
Pick a month and the map shows its ten-year average. Wind and waves draw as roses: each petal points where it comes from, longer the more often, coloured by how strong. Step through the year to watch the seasons turn.
- Eight layers
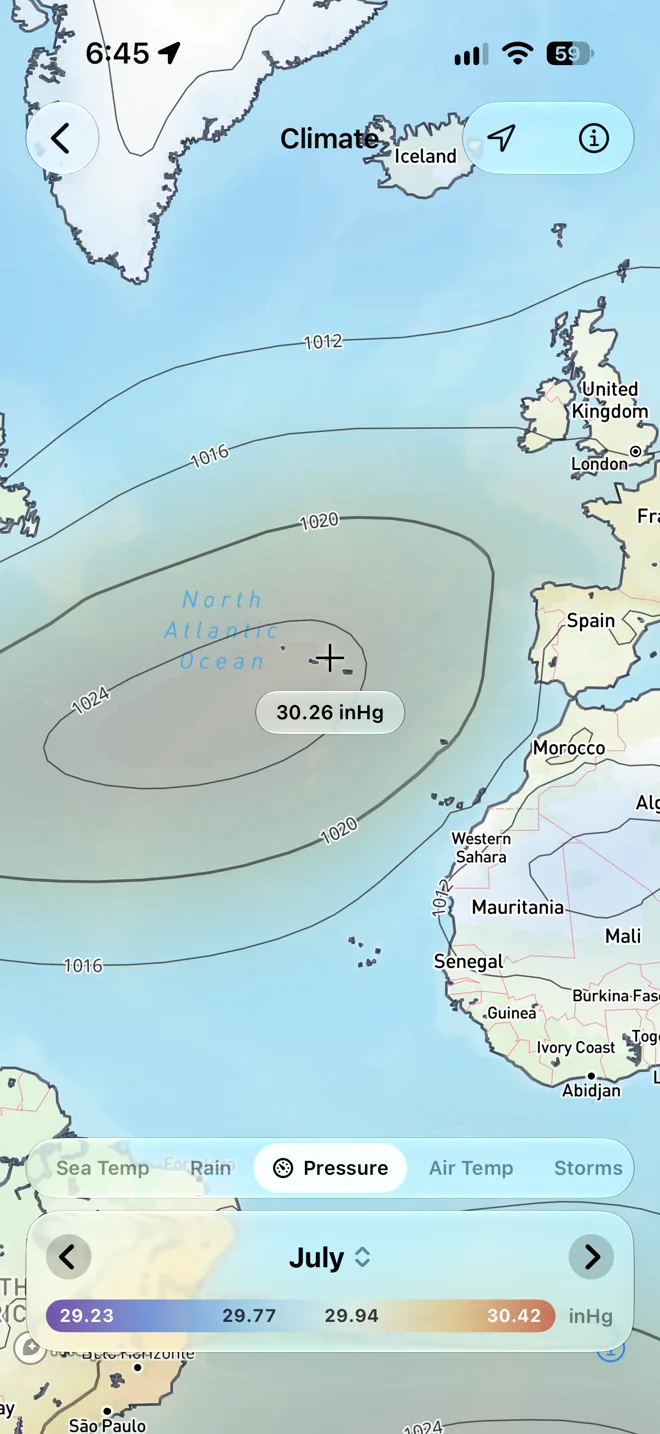
- Wind, waves, currents, rain, pressure with its isobars, sea and air temperature, and thunderstorm days.
- Read any spot
- The crosshair reads the average under it, like 13 kts or 62 mm, as you pan the map.
- Always the last ten years
- Each month moves on about a week after it ends, so the averages stay current.
Storms
See the storm season build
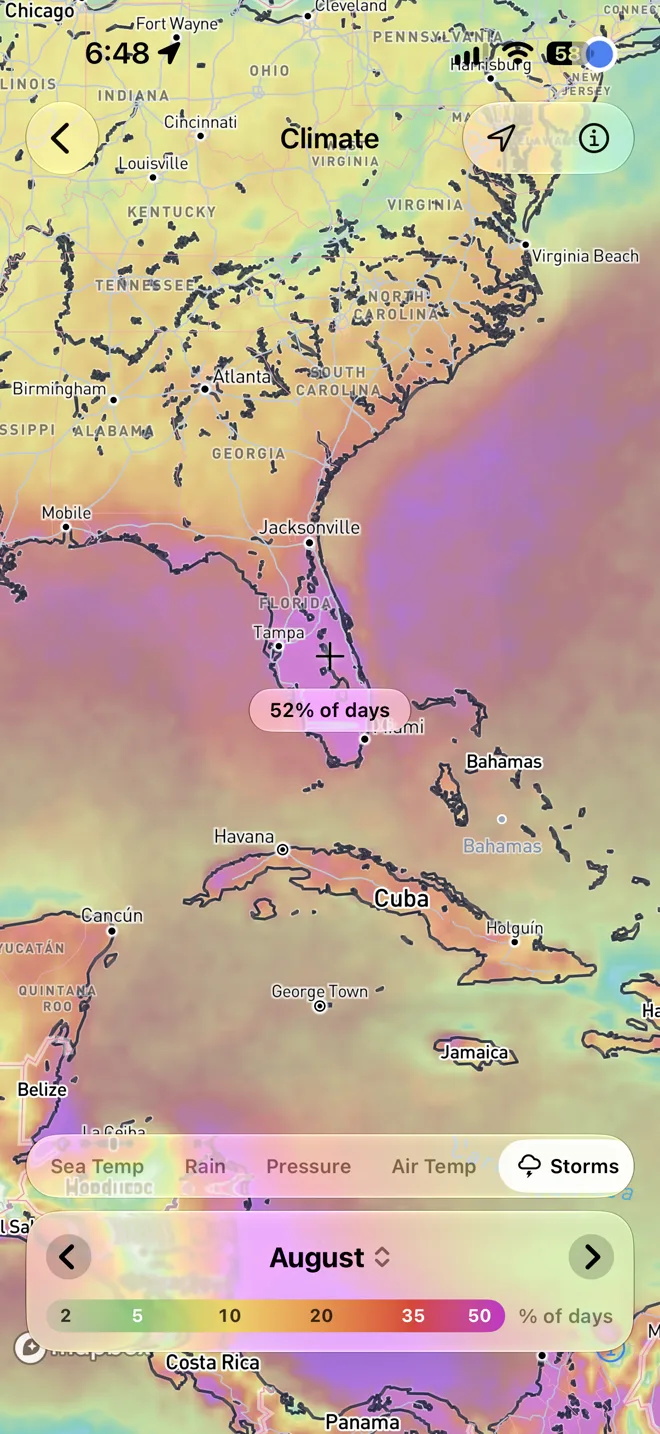
Storms shows how often a day brings thunderstorms. In August, more than half the days over Florida do, and more than a third just off its coasts. Step through the months to watch the season build and fade.
- Thunderstorm days
- A day counts when the air was unstable enough for thunderstorms and showers actually fell.
- At any place
- Tap the map, and Rain lists the month's days with thunderstorms beside its days with rain.
Any place
Tap anywhere for the details
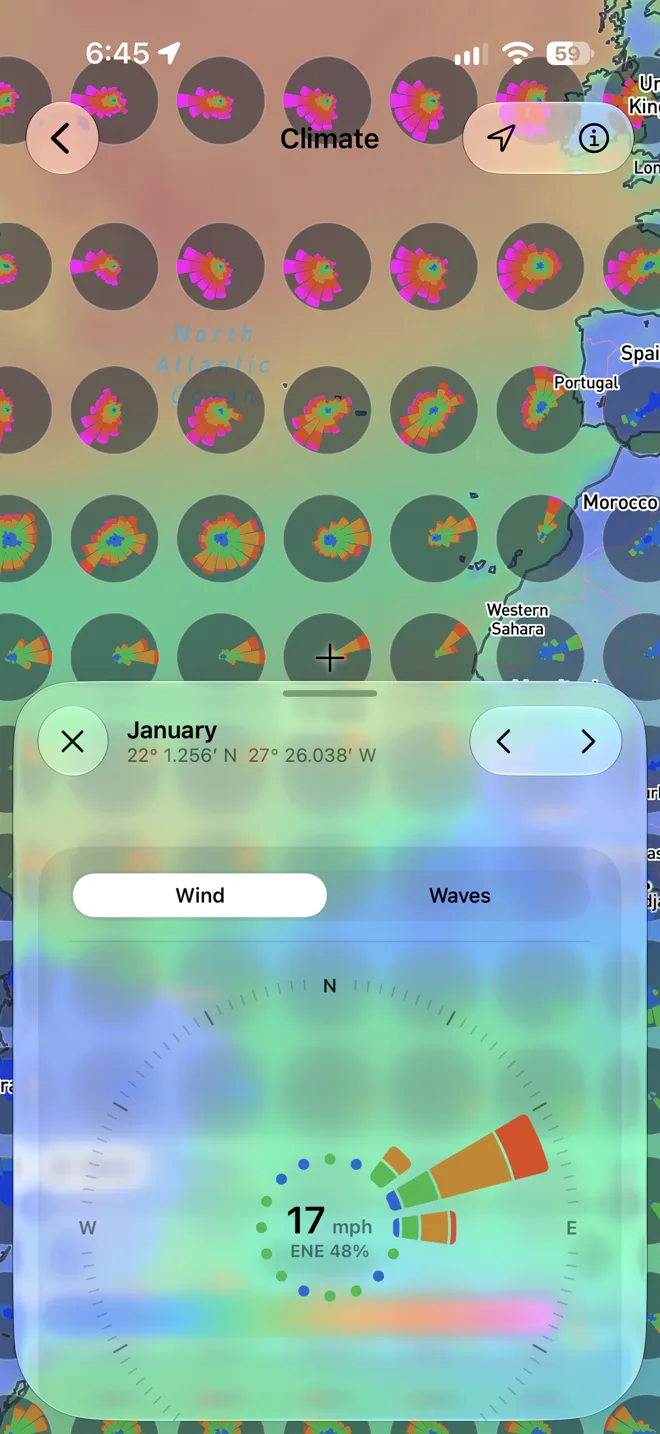
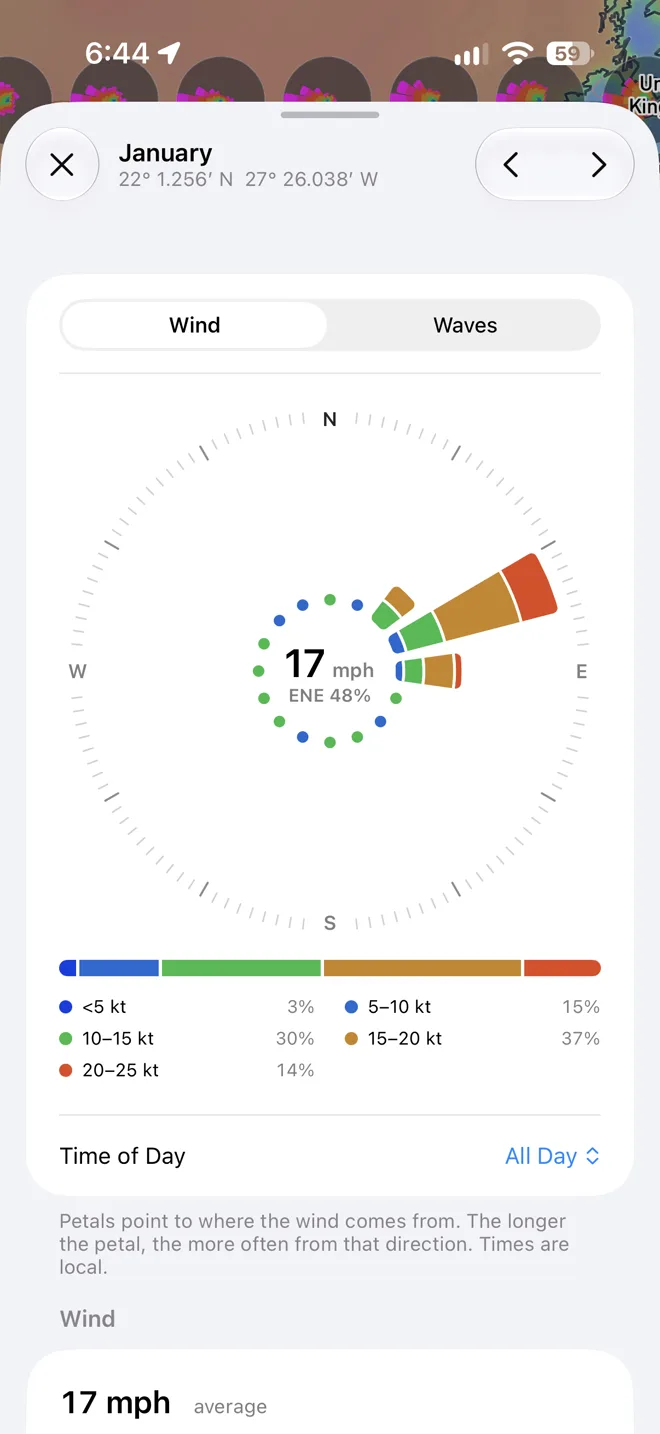
Tap the map for a larger rose and the month's numbers there: how strong the wind and waves are, how often it blows a gale, how big the waves get, the current, the rain, and the temperatures.
- Time of day
- See the morning, the afternoon, and the night apart, by the sun at that place. Sea breezes and afternoon storms show up.
- Wind and waves
- A rose of the wind, or of the waves by height or by period, with the share of time in each strength.
- The sea in numbers
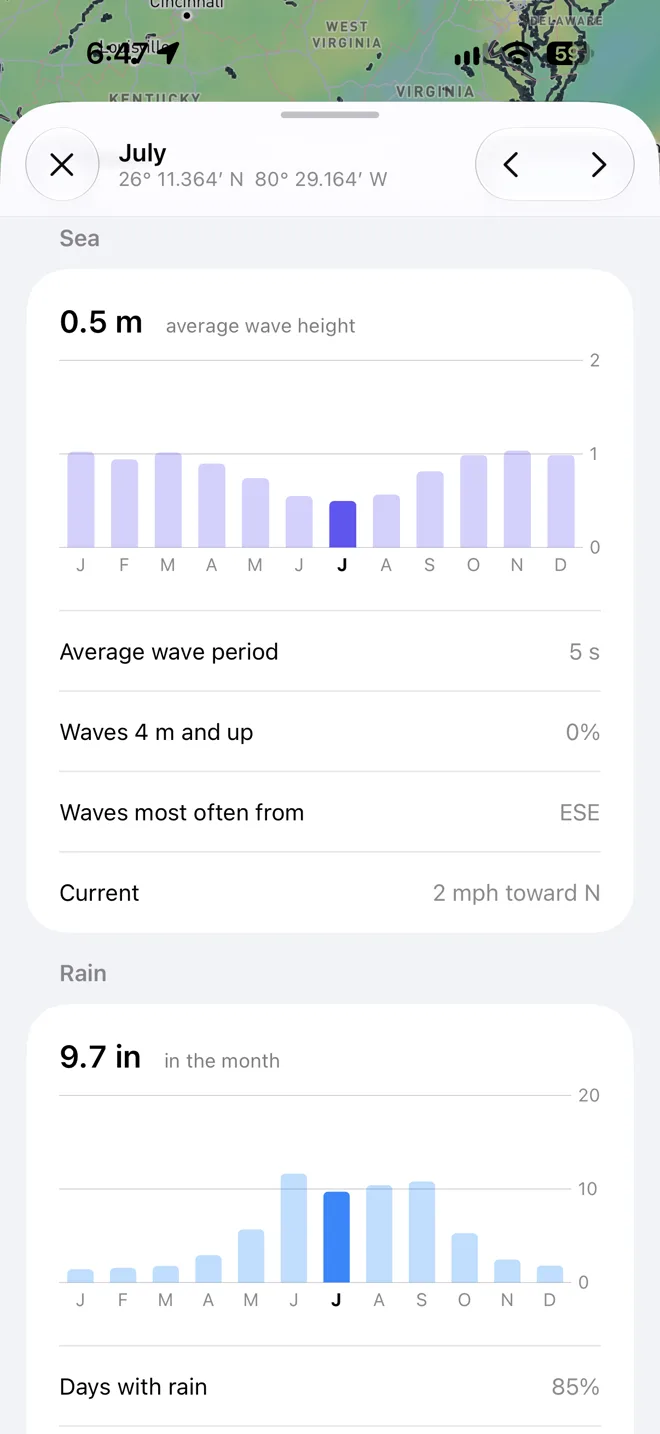
- The average wave period, how often waves reach 4 m, the current, and sea ice where there is any.
The whole year
Every month at a glance
Charts of the whole year show the wind, the seas, the rain, and the air and sea temperature month by month, with the month you picked standing out. Compare the seasons without stepping through them, and tap a month to switch to it.
- When it's calm
- Find the months with the lightest wind and the smallest waves.
- When it's wet
- See the rainy season coming, and the days with thunderstorms.
- When it's warm
- The air and the sea through the year, with the daily high and low.
User guide
Learn Climate inside out
See what a month is usually like anywhere on the ocean, from ten years of wind and wave roses, rain, pressure, sea temperature, storms, and currents, to pick the right season for a passage.
There's more
More from OceanPulse
- Coastal Charts Official NOAA charts for the US, the Great Lakes, and US territories, plus the major inland rivers, with markers, routes, and offline downloads.
- Tracks Record your trips and share them live as you go (Elite), then review, search, and export them, with distance, time, and speed for each.
- Forecast Alerts Set the wind, waves, tide, and weather you want at a spot, and get a push or an email when the forecast matches.
- Anchor Alarm Leave an iPhone or iPad aboard to watch the anchor. It sounds an alarm if the boat drags, loses GPS, or runs low on battery, and your phone follows along ashore.
- Weather Routing Pick a start, an end, and a departure time, and watch GFS, ECMWF, and AIFS race to the fastest route for your boat, with every hour of wind and seas along the way.
- NMEA Connect Connect to your boat's NMEA 0183 gateway or Signal K server over WiFi. See AIS traffic on the chart with a close approach alarm, use the boat's GPS, and read its instruments.
Ready to dive in?
Start using OceanPulse today.