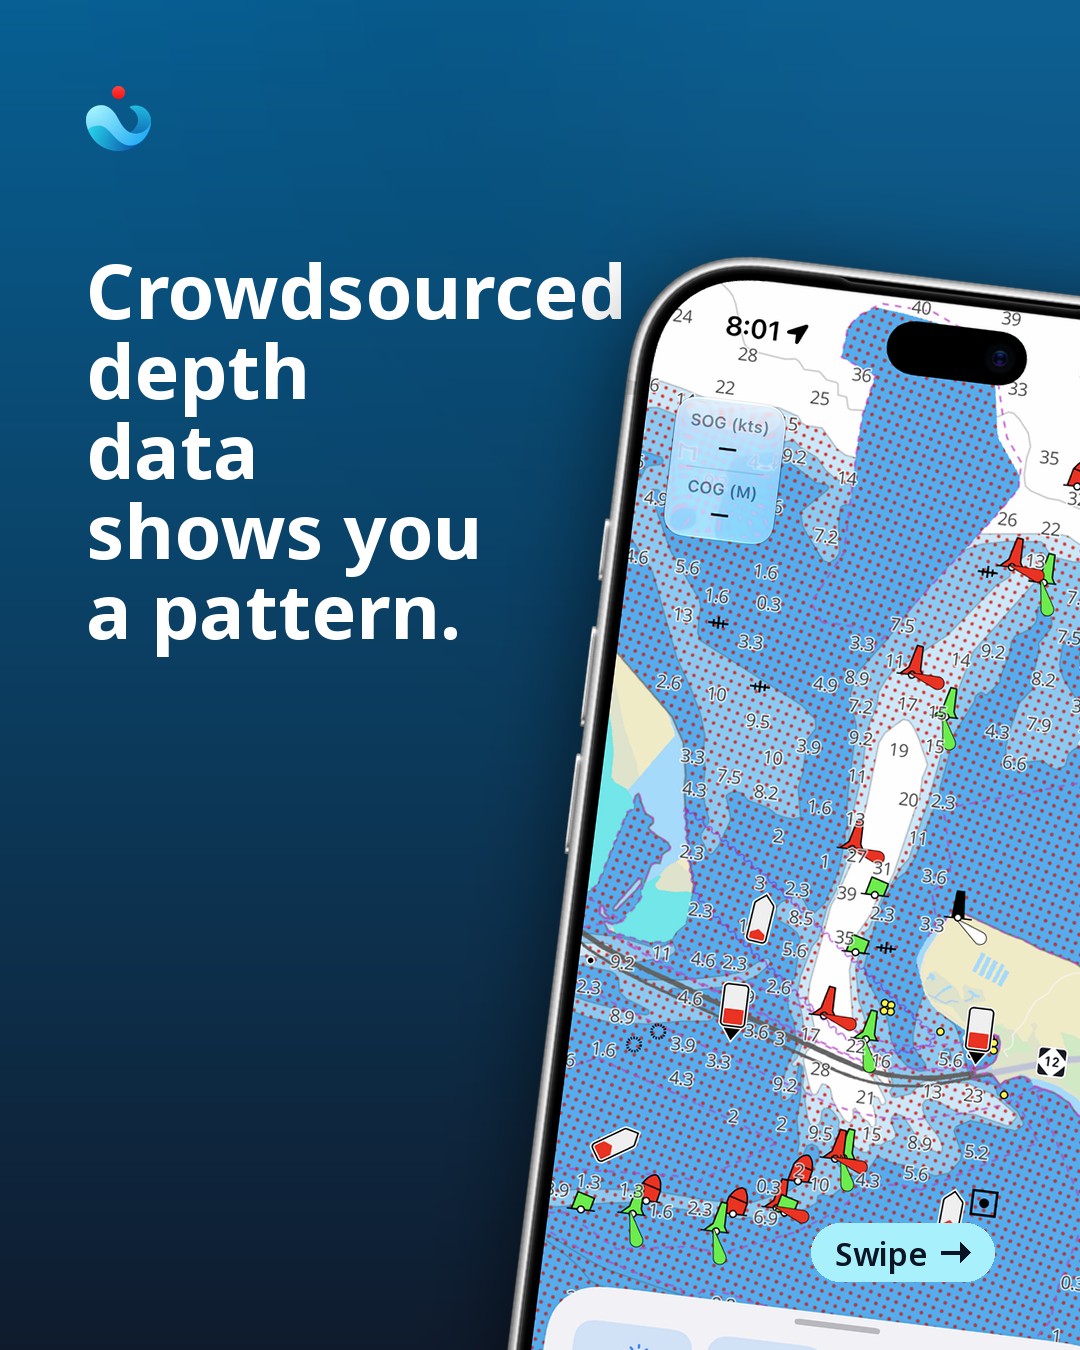
Oregon Inlet, North Carolina, sits between a barrier island and the open Atlantic, and the sand underneath it does not sit still. The channel has moved enough times that the Army Corps dredges it on a near-constant schedule, and NOAA re-surveys the approach more often than almost anywhere else on the East Coast. It is a good place to think hard about where crowdsourced depth data actually helps, and where it quietly sets you up.
What crowdsourced depth is good for. When a few hundred recreational boats cross the same patch of water over a season, their logged tracks can show a real pattern — a general lane that stays passable, a shoal that keeps reappearing in the same spot. Used that way, as a rough confirmation of a trend, it adds something a single chart edition cannot: recency, in bulk. That has genuine value in water that moves.
What it isn’t. A single track is one boat, one draft, one moment of tide, recorded by a GPS with its own error budget. It does not tell you the stage of tide the boat crossed on, whether it was riding a wake up over a bar, or whether the skipper’s autopilot cut the corner a chart would not. Stack a thousand of those together and you get a cloud of depths, not a sounding. At an inlet like Oregon Inlet, where the shoal can shift measurably between one spring and the next, a crowdsourced track from last October is a photograph of a channel that has already changed.
The failure mode is specific: a boater sees a well-traveled line on a depth layer, reads it as “other people go through here,” and does not ask when. Other people went through there. The sand under that line may not have waited around.
The practical rule. Treat crowdsourced depth as a hint about where to look, never as a sounding to steer by. The charted number is still the baseline — it comes from a survey with a known date and a known method, even when that date is old. At a shifting inlet, pair that chart with the local notice-to-mariners traffic and, where you can get it, a very recent local report: a towboat captain, a marina, a fisherman who crossed that morning. None of that is instant, and none of it is a substitute for slowing down and reading the water in front of you — the color change, the breaking pattern, the set of the current across the bar.
In OceanPulse, NOAA’s charted soundings are what you see on the chart, with the edition and survey basis attached, not a crowdsourced overlay. Press and hold any point on the chart and you get the official sounding and chart detail for that spot, not a blended guess. Charts download for offline use before you lose signal running the approach, which matters at inlets where cell coverage drops right where you need the chart most. None of that changes the sand. It just means the number you are looking at tells you where it came from — which, at a place like Oregon Inlet, is most of the decision.